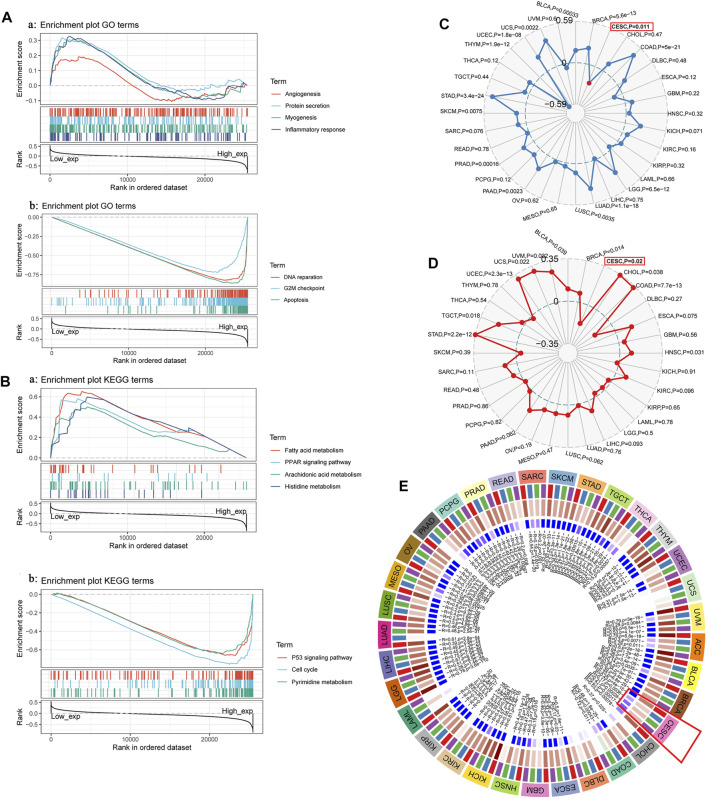
FIGURE 5.
(A) and (B) GSEA investigation of TYMS. (C) The radar diagram shown the correlation between TYMS gene expression and tumor mutational burden (TMB). The red dots represent the correlation between TYMA and TMB in cervical cancer. The dotted blue circle in the middle represents the dividing line between positive and negative correlations. (D)The radar diagram shown the correlation between TYMS gene expression and microsatellite instability (MSI). The red box represents the association between TYMS and MSI in cervical cancer. The dotted circle in the middle represents the dividing line between positive and negative correlations. (E) Correlation between TYMS gene expression and four methyltransferases (DNMT1: red, DNMT2: blue, DNMT3A: green, DNMT3B: purple) expression. The red box represents the association between TYMS and methyltransferases in cervical cancer.

