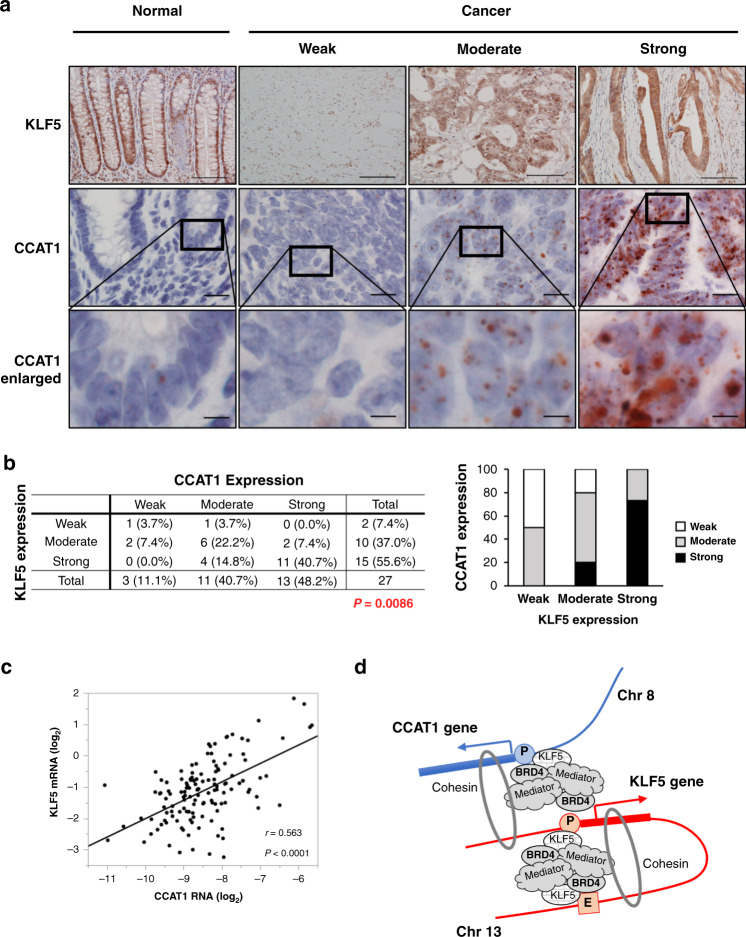
Fig. 6. KLF5 and CCAT1 expression is correlated in CRC tissues.
a Representative images of KLF5 protein and CCAT1 RNA expression in normal colorectal epithelium and CRC. The expression level of KLF5 in tumour cells was evaluated at ×100 magnification. Nuclear staining of the KLF5 protein was scored based on the percentage of positive cells as follows: weak: 0–10%, moderate: 11–50%, strong: 51–100%. The expression level of CCAT1 in tumour cells was evaluated at ×100 magnification and scored as previously reported [32]. Score 0 was defined as weak, score 1–2 was defined as moderate, and score 3–4 was defined as strong. The bottom panels show the higher magnification image of the framed area. Scale bar: 100 μm (top), 20 μm (middle), 5 µm (bottom). b The percentage of each score (weak, moderate, strong) of KLF5 protein and CCAT1 RNA expression in CRC clinical samples. The bar chart is also shown. c The correlation of KLF5 mRNA and CCAT1 RNA expression in 131 CRC clinical samples. The expression levels of KLF5 mRNA and CCAT1 RNA were significantly correlated (r = 0.563, P < 0.0001). d Illustration model showing the gene regulation mechanism for KLF5 and CCAT1 via the three-dimensional genome structure.

