Figure 1.
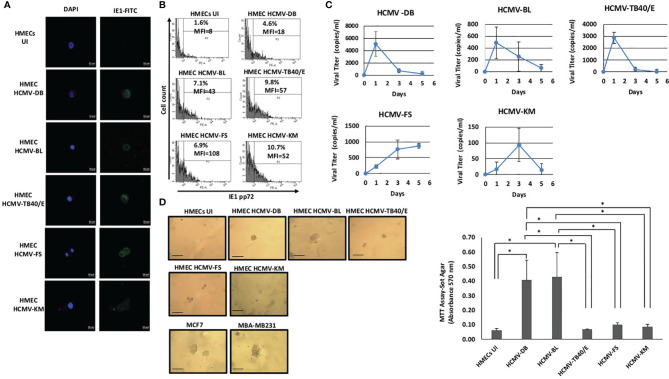
Replication and transforming capacities of five HCMV strains in HMEC cultures. (A) Confocal microscopic images of DAPI and IE1 staining in HMECs infected with HCMV-DB, HCMV-BL, HCMV-TB40/E, HCMV-FS, and HCMV-KM. Uninfected HMECs (UI) was used as negative control. Magnification X63, scale bar 10 μm. Data shown are representative of three independent experiments. (B) Detection of IE1 (pp72) protein in HMECs infected with HCMV-DB, HCMV-BL, HCMV-TB40/E, HCMV-FS, and HCMV-KM. Uninfected HMECs (UI) was used as negative control. Data are represented as mean ± SD of two independent experiments. (C) Growth kinetics of the five HCMV strains in HMECs up to day 5 post-infection. Measurement of IE1 by qPCR in order to assess the viral growth. Data are represented as mean ± SD of three independent experiments. (D) Colony formation in soft agar seeded with HMECs infected with HCMV-DB, HCMV-BL, HCMV-TB40/E, HCMV-FS, and HCMV-KM at MOI of 1. MDA-MB231 and MCF7 were used as positive controls. Uninfected HMECs were used as negative control. Colonies were observed under an inverted light microscope (magnification ×100, scale bar 100µm). Right panel. Quantification was performed at day 15 post-seeding. Histogram represents mean ± SD of three independent experiments. p-values were determined by Wilcoxon test. *p-value < 0.05.

