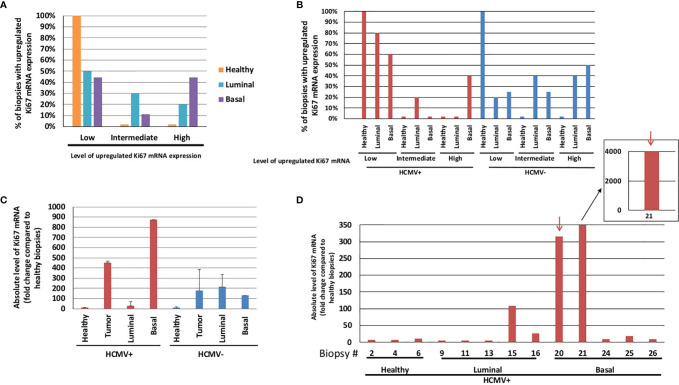
Figure 7.
Ki67 gene expression parallel to HCMV detection in healthy and tumor (luminal and basal) breast biopsies. (A) Histograms representing the percentage of healthy and tumor (luminal and basal) biopsies with an upregulated Ki67 mRNA expression compared to healthy tissue (B) in the presence/absence of HCMV. (Level of upregulated Ki67 mRNA expression: Low<30, 30<Intermediate <100, and High >100) (C) Histogram showing the mean ± SD of absolute levels of Ki67 mRNA in healthy, tumor (luminal + basal), luminal, and basal biopsies which were grouped into HCMV-positive and HCMV-negative biopsies. (D) Detailed absolute levels of Ki67 mRNA in HCMV-positive biopsies (healthy, luminal, and basal biopsies). Red arrows, two HCMV strains detected in basal tumors which expressed high Ki67 levels. Each number on the X-axis represents one healthy, luminal or basal biopsy. Biopsy details can be found in Supplementary Table 1 and in Materials and Methods.

