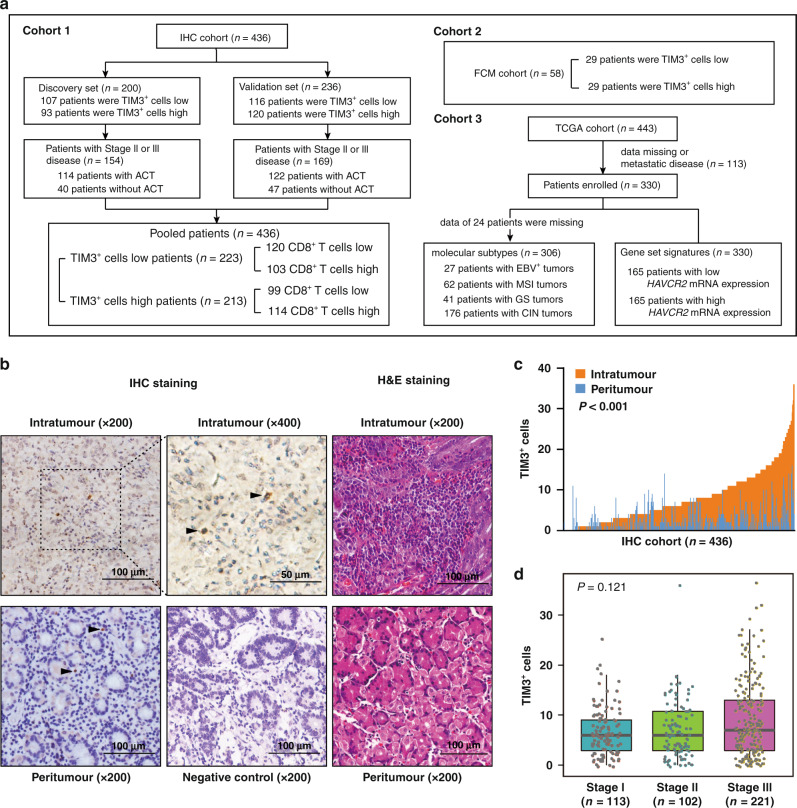
Fig. 1. TIM3+ cells are densely infiltrated in gastric cancer tissues and associated with disease progression.
a Flow diagram for characterisation of three cohorts involved in this study. b Representative images of immunohistochemistry (IHC) for TIM3+ cells (left and median panel) and haematoxylin–eosin (H&E) staining (right panel) in gastric tissues. Arrowheads show TIM3+ cells. c Comparison of TIM3+ cell infiltration between intratumoural (n = 436) and peritumoural (n = 436) gastric tissues based on IHC evaluation. Paired t test. d Boxplots display the association between intratumoural TIM3+ cell infiltration and TNM stage. Kruskal–Wallis test. P values less than 0.05 were shown in bold.

