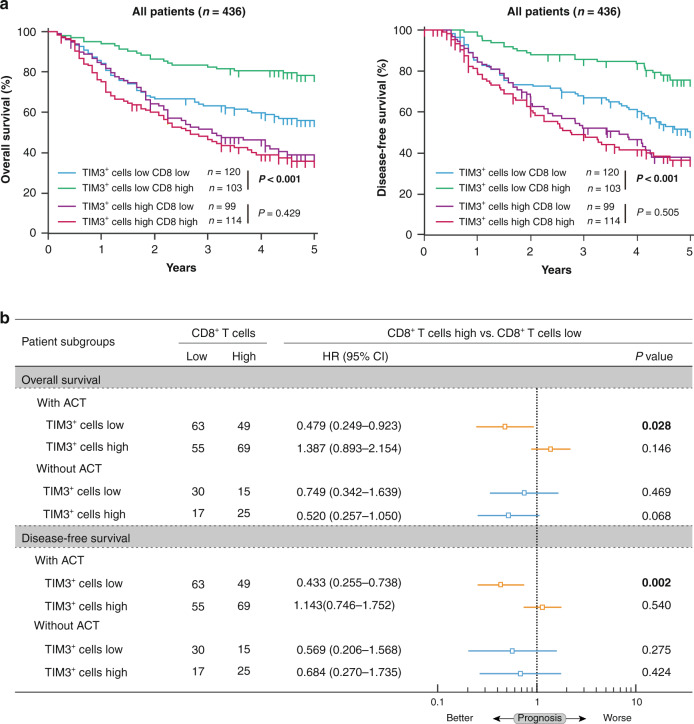
Fig. 5. TIM3-associated CD8+ T cell dysfunction indicates inferior chemotherapeutic responsiveness in gastric cancer.
a Kaplan–Meier curves of overall survival (left panel) and disease-free survival (right panel) based on the combination of CD8+ T cells and tumour-infiltrating TIM3+ cells in all patients. Log-rank test was utilised for the analysis. b Multivariate Cox analysis of overall survival and disease-free survival was performed based on CD8+ T cell infiltration in TIM3 low and high subgroups, with ACT treatment or not. HR hazard ratio, CI confidence interval. P values less than 0.05 were shown in bold.

