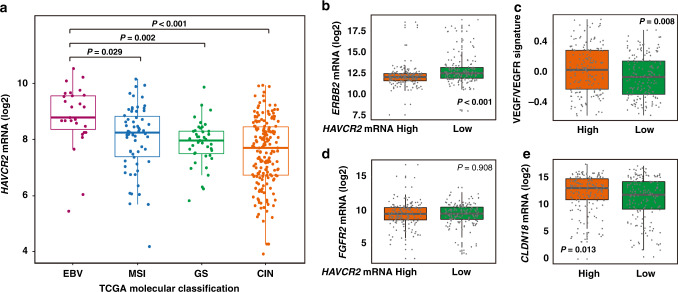
Fig. 6. Characterisation of molecular subtypes based on HAVCR2 mRNA expression.
a Comparison of HAVCR2 mRNA expression in TCGA database across 2018 TCGA molecular classification. Kruskal–Wallis test followed by Dunn’s multiple comparisons. b, e Comparison of ERBB2 mRNA expression (b), VEGF/VEGFR signature (c), FGFR2 mRNA expression (d), CLDN18 mRNA expression (e) between low and high HAVCR2 mRNA expression subgroups in TCGA database. Mann–Whitney U test for (b); Student’s t test for (c–e). EBV Epstein–Barr virus, MSI microsatellite instability, GS genomically stable, CIN chromosomal instability. P values less than 0.05 were shown in bold.

