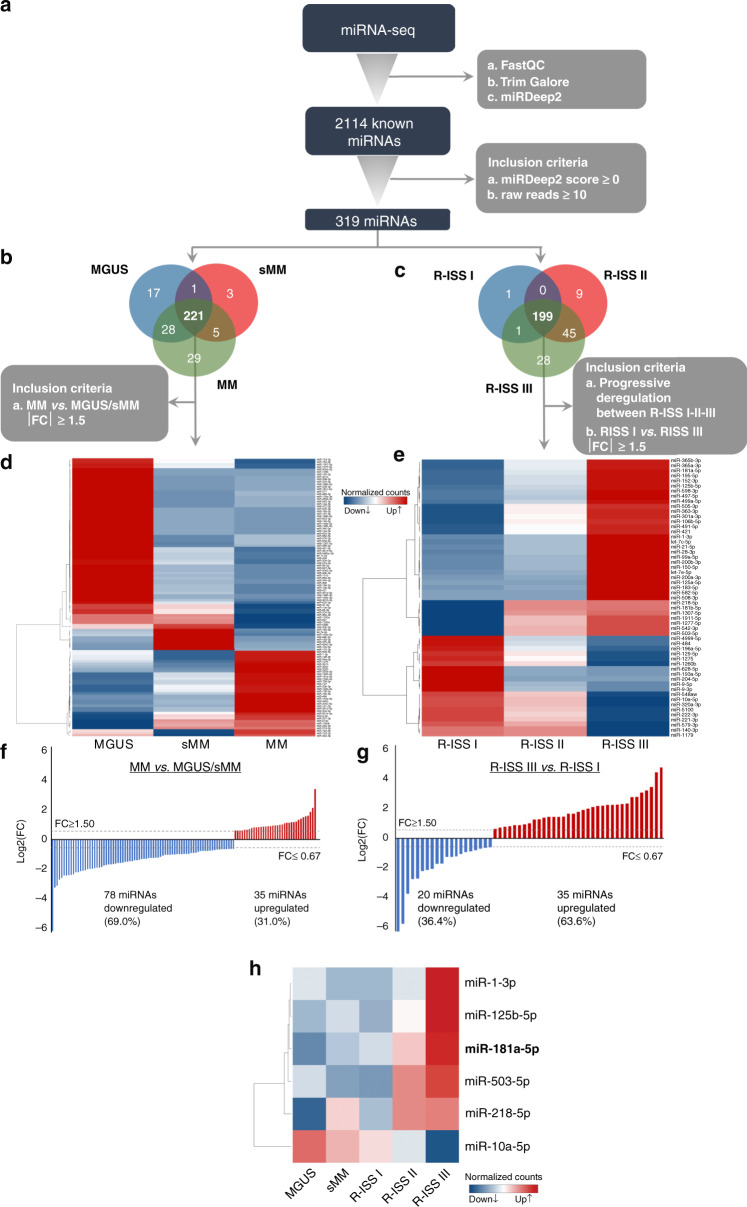
Fig. 1. miRNAs profile of CD138+ plasma cells.
Workflow diagram of miRNA-seq analysis of CD138+ plasma cells in MM, sMM and MGUS patients (a). Venn diagram representing shared miRNAs between MM, sMM and MGUS (b) and between R-ISS I-II-III (c) patients. Heatmap of the differently expressed miRNAs between MM, sMM and MGUS (d) and between R-ISS I-II-III (e) patients. Bar graph of miRNAs log2FC in MM vs. MGUS/sMM (f) and in R-ISS III vs. R-ISS I stages (g). Heatmap of the concurrently altered miRNAs between MGUS, sMM and R-ISS stages. Colour gram depicts high (red) and low (blue) expression levels of miRNAs (h). FC fold change.

