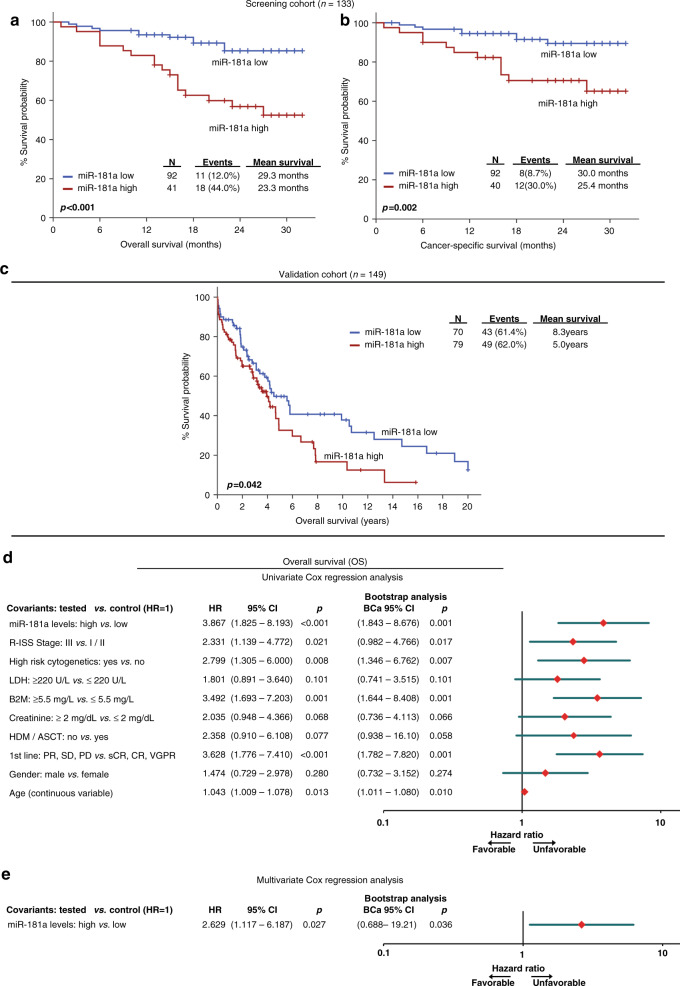
Fig. 2. CD138+ overexpression of miR-181a is strongly correlated with worse survival outcome following treatment.
a–c Kaplan–Meier survival curves for overall survival (OS; a) and cancer-specific survival (CSS; b) of the MM screening cohort, as well as OS (c) of the Kruykov et al. 2016 validation cohort, according to miR-181a expression. p-values calculated by log-rank test. d, e Forest plots of the univariate (d) and multivariate (e) Cox regression analysis for the OS of MM patients. Multivariate analysis adjusted for miR-181a, R-ISS stage, high-risk cytogenetics, B2M, LDH and creatinine levels, gender, age and response to 1st-line therapy. Internal validation was performed by bootstrap Cox proportional regression analysis based on 1000 bootstrap samples. HR Hazard Ratio, 95% CI 95% confidence interval of the estimated HR, BCa 95% CI bootstrap bias-corrected and accelerated 95% CI of the estimated HR based on 1000 bootstrap samples.

