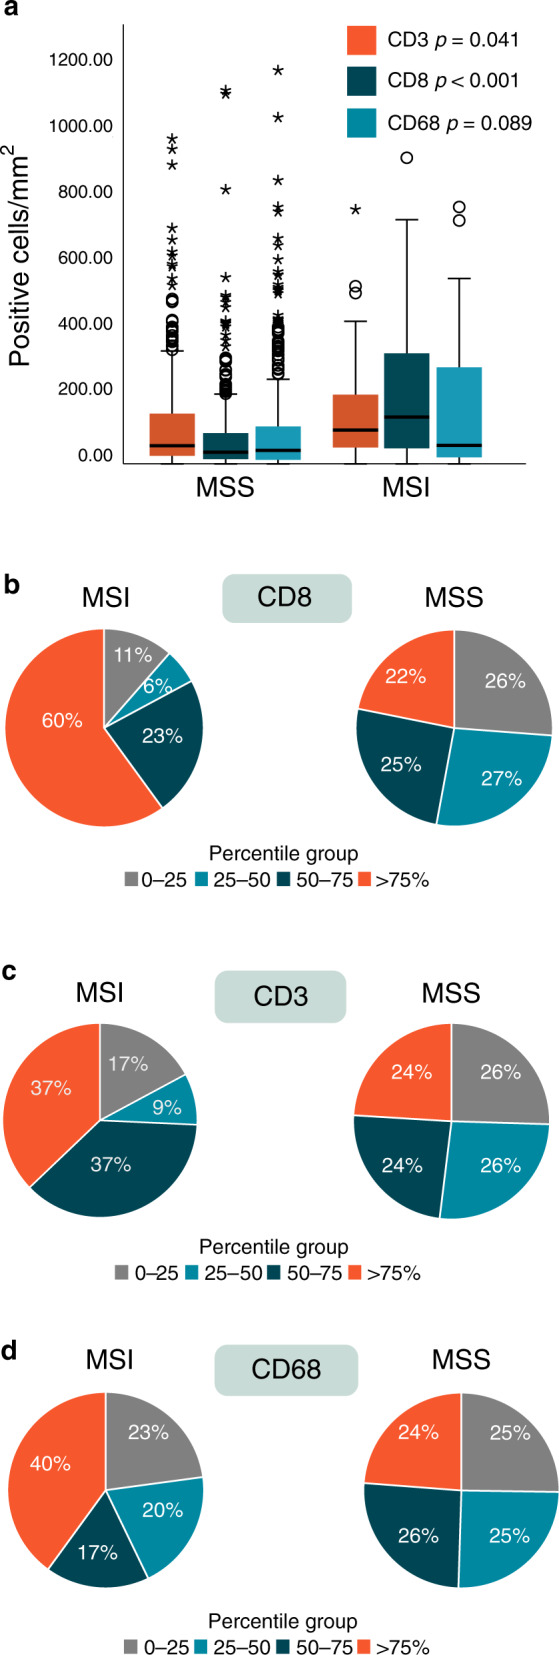
Fig. 2. Density of tumour-infiltrating CD3, CD8 lymphocytes and CD68 macrophages according to tumour microsatellite instability (MSI) and microsatellite stable (MSS) status in a Scandinavian population-based cohort of metastatic colorectal cancer.

a Density illustrated by boxplot, horizontal line marks the median value, outliers are represented by circles (mild) and stars (extreme); extreme values >1200 are not shown in the figure, p value: Mann–Whitney U-test. b Percentage of cases in the four percentile groups of CD8 density. c Percentage of cases in the four percentile groups of CD3 density. d Percentage of cases in the four percentile groups of CD68 density.
