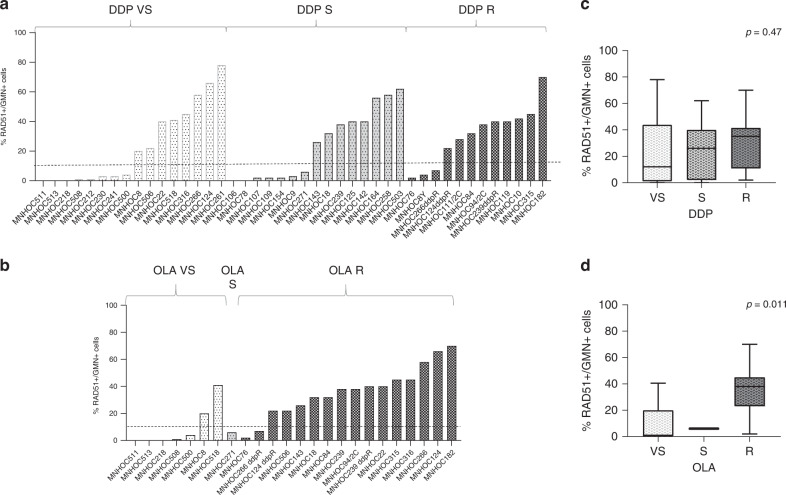
Fig. 4. RAD51 foci in geminin-positive cells and responses to cisplatin and olaparib in the OC-PDXs.
a, b Percentage of RAD51+/GMN+ cells in the OC-PDXs clustered for their responses to cisplatin (DDP) (a) and olaparib (b) (white bars: very sensitive; pale grey: sensitive; dark grey: resistant). c, d Box plots showing the correlation between RAD51 foci positivity, based on the percentage of RAD51+/GMN+ cells (≤10%, RAD51 negative; >10%, RAD51 positive) and responses to DDP (c) and olaparib (d).

