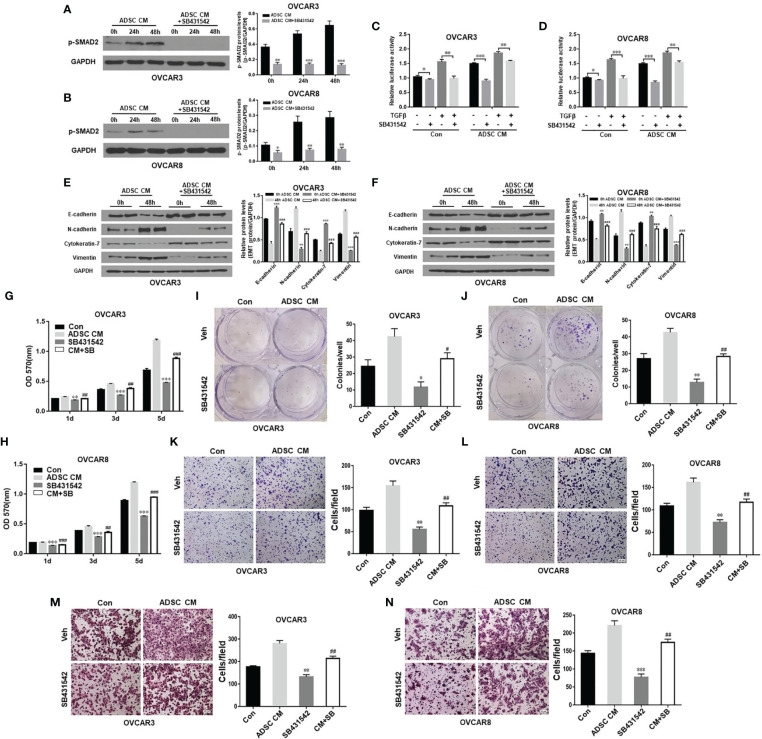
Figure 3.
Inhibition of TGF-β pathway antagonizes ADSC-induced OC growth, migration, and invasion. (A, B) Western blot analysis of the p-SMAD2 expression in both OVCAR3 (A) and OVCAR8 (B) cells treated with 10 μM SB431542 for 24 h and then ADSC-CM for different time durations. Right, the quantification analysis of the blots. (C, D) Luciferase activity in OVCAR3 (C) and OVCAR8 (D) cells following ADSC-CM treatment for 24 h, SB431542 treatment for 24 h, then 6 ng/ml TGF-β treatment for 12 h. (E, F) Western blot analysis of EMT markers in both OVCAR3 (E) and OVCAR8 (F) following treatment with ADSC-CM and SB431542 (10 μM) for 48 h. Right, the quantification analysis of the blots. (G, H) MTT assay was performed to detect the cell proliferation ability of OVCAR3 (G) and OVCAR8 (H) cells at different time points following ADSC-CM and SB431542 (10 μM) treatment. (I, J) Cell colony formation assay determined cell survival in OVCAR3 (I) and OVCAR8 (J) cells following ADSC-CM and SB431542 (5 μM) treatment. (K, L) Cell migration in OVCAR3 (K) and OVCAR8 (L) cells treated with ADSC-CM or control medium following SB431542 (10 μM) treatment 24 h performed using Transwell plates. (M, N) Cell invasion in OVCAR3 (M) and OVCAR8 (N) cells treated with ADSC-CM or control medium following SB431542 (10 μM) treatment for 24 h using Matrigel-coated plates. Data represent the mean ± SD of three independent experiments. * p < 0.05, ** p < 0.01, *** p < 0.001 compared with the corresponding control group; # p < 0.05, ## p < 0.01, ### p < 0.001 compared with the corresponding ADSC-CM group.

