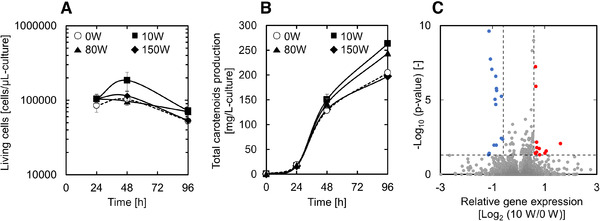
FIGURE 3.

(A) Time course of number of living cells during ultrasonic‐irradiated extractive fermentation with isopropyl myristate. Data represent the mean ± SD from three independent experiments. (B) Time course of number of total carotenoids production during ultrasonic‐irradiated extractive fermentation with isopropyl myristate. Data represent the mean ± SD from three independent experiments. (C) Volcano plot showing changes in gene expression between irradiated and non‐irradiated fermentations. The vertical axis indicates ‐log10 (p‐value), and the horizontal axis indicates log2 fold change. Vertical lines represent fold changes of ±1.5 (log2 fold change is approximately ±0.58). The horizontal line represents a p‐value of 0.05 (‐log10 p‐value is approximately 1.30). Red and blue dots represent up‐ and down‐regulated genes, respectively. Gray plot points represent genes whose expression level did not change
