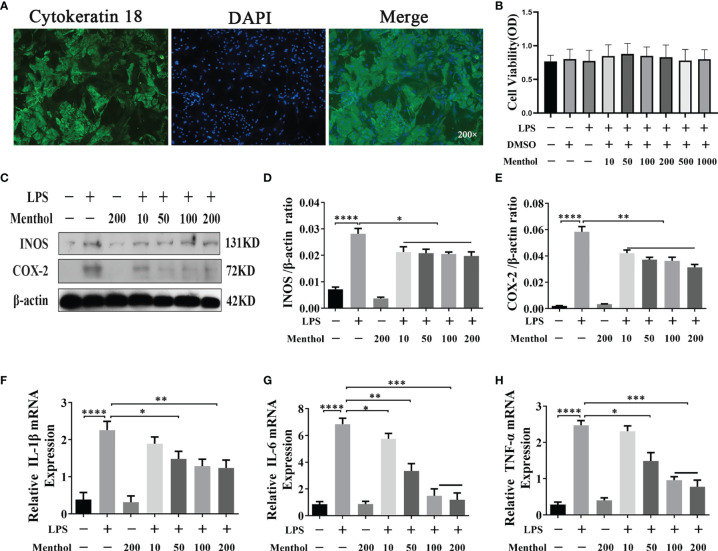
Figure 1.
Effect of menthol on the LPS-induced inflammatory response in BMECs. (A) Immunofluorescence staining to identify CK-18 expression in BMECs. Nuclei (blue) and CK-18 (green); scale bars are magnification 200x. The BMECs were treated with DMSO (solvent control group) and different concentrations of menthol (10, 50, 100, 200, 500, and 1000 μM) for one hour and then treated with 5 μg/ml LPS for 12 h. (B) Results of the cell counting kit (CCK-8) to detect the activity of BMECs (n≥3). BMECs were treated with different concentrations of menthol (10, 50, 100, and 200 μM) for 1 h and LPS at 5 μg/ml was added for 12 h. (C) Western blotting assay for INOS and COX-2 protein expression levels (n≥3). (D, E) The bar graphs indicate the quantitative results of the corresponding protein bands. (F–H) qRT-PCR results for the mRNA levels of IL-6, IL-1β and TNF-α. β-actin was used as an internal reference to normalize the expression levels of protein and mRNA (n≥3). The values are presented as the means ± SEM (*p < 0.05, **p < 0.01, ***p < 0.001 and ****p < 0.0001).

