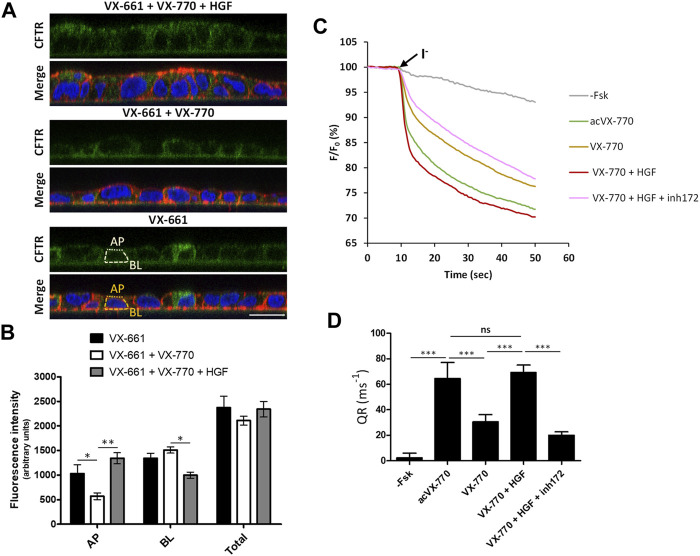
FIGURE 4.
Co-treatment with HGF improves the apical abundance and function of rescued F508del-CFTR after prolonged exposure to VX-661+Vx-770 modulator combination. (A) Immunofluorescence staining of polarized F508del-CFTR CFBE cells treated for 15 days with either VX-661 (3 μM) alone, VX-661 plus VX-770 (1 μM), or VX-661+VX-770 and 50 ng/ml HGF, were stained with anti-CFTR/Alexa 488 (green), phalloidin-TRITC (red) and DAPI (blue), and analyzed by confocal microscopy as in Figure 2A. (B) Plotted are means ± SEM of AP, BL and Total (BL + AP) signal intensities from at least 25 cells analyzed in each of three independent experiments. Two-way ANOVA identified significant variation in CFTR’s subcellular localization among treatments (F = 61.01, p < 0.0001). Bonferroni posttests were used to compare treatments at the different subcellular localizations. *p < 0.05; **p < 0.01. (C) Representative traces of fluorescence decay on iodide influx assays of polarized HS-YFP/F508del-CFTR CFBE cells treated for 15 days with 3 μM of VX-661, alone or together with VX-770 (1 μM), or VX-770 and HGF (50 ng/ml). Cells were then stimulated with either DMSO (- Fsk), 5 μM forskolin, or 5 μM forskolin and 10 μM VX-770 (acVX-770) for 30 min, in the presence or absence of 25 μM CFTR inhibitor 172 (inh172). Fluorescence decay was recorded and analyzed as in Figure 2C. (D) Fluorescence decay rates (QR) were calculated as described in Figure 2D. Data are means ± SEM of five independent assays. Statistical significance between treatments was assessed using one-way ANOVA (F = 229.5, p < 0.0001) followed by Tukey’s posttests (***p < 0.001, ns = not significant).

