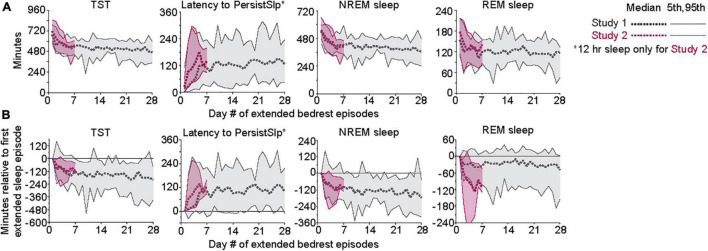
FIGURE 1.
(A) Patterns of TST, Latency to PersistSlp, NREM Sleep, and REM Sleep per 24-h across days of both Studies. Gray lines are data from Study 1; red lines are data from Study 2. For each experiment, 5th, 50th (median), 7 and 95th percentiles are shown. Data for NREM Sleep Stage 1, NREM Sleep Stage 2, SWS, Wake in PersistSlp. Final Wake Duration, and Sleep Episode Duration are in Supplementary Figure 2. (B) As in panel (A) except all values relative to the value for each individual’s first night value.

