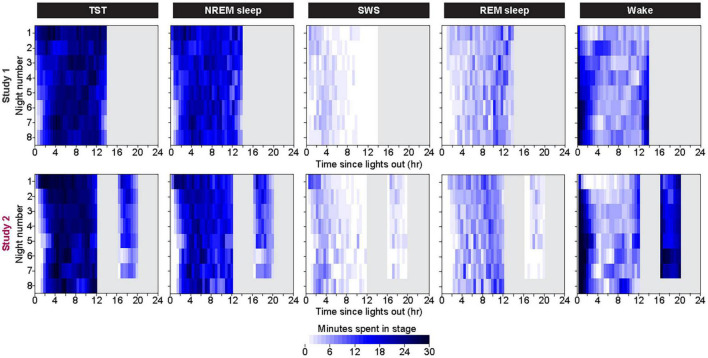
FIGURE 3.
Color heat maps of 30-min bins for the median (across all participants) for TST, NREM Sleep, REM sleep, and Wake for each day of the protocol. Top row contains data from first 8 days of Study 1 and bottom row contains data from all 8 days of Study 2. For ease of viewing, data on each line are plotted as relative to time of lights out for the main bedrest episode. Clock time for Study 1 time of lights out was 1800–0800. Study 2 had bedrest episodes scheduled relative to each individual’s habitual bedtime. Color heat maps for the entire 28 days of Study 1 are in Supplementary Figure 3.

