
FIGURE 5.
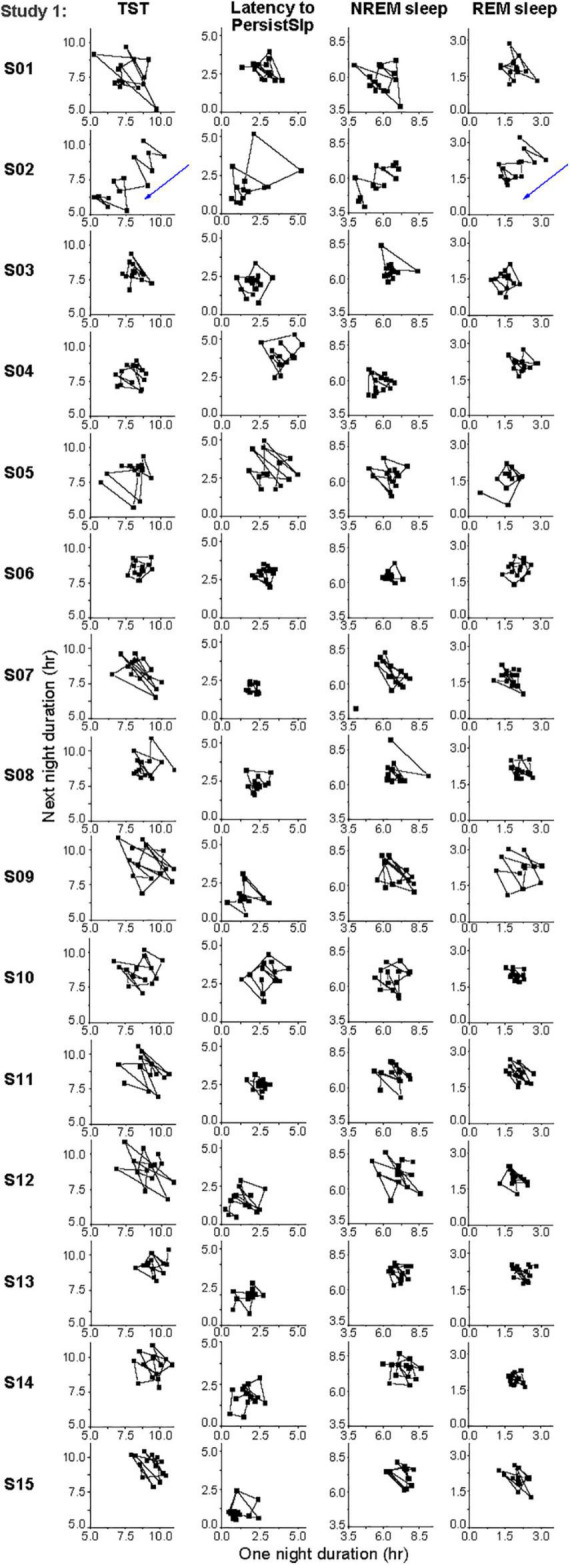
Individual daily variations in hours of TST, Latency to PersistSlp, NREM Sleep, REM Sleep in the last 14 nights of Study 1. Consecutive current day value vs. next day value (both in hours) are plotted for each individual. Participant numbers are the same as in Figure 4.