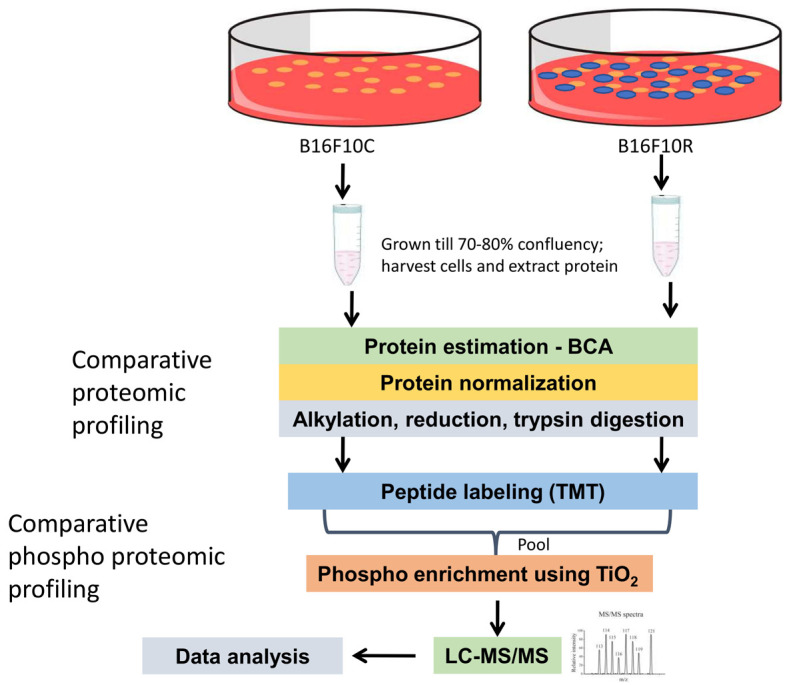
Figure 1.

Schematic representation of the workflow for the quantitative proteomic and phosphoproteomic analysis of parental B16F10 cells and drug-resistant B16F10 cells. Cells were allowed to grow to 80% confluency (control were vehicle-treated while resistant cells were treated with 10 µM of U0126 and LY294002). Cells were lysed with lysis buffer and protein samples were digested with trypsin followed by TMT labeling. Samples were pooled after fractionation and phospho-peptides were enriched using TiO2 beads. The resulting samples were analyzed on an Orbitrap Fusion mass spectrometer.
