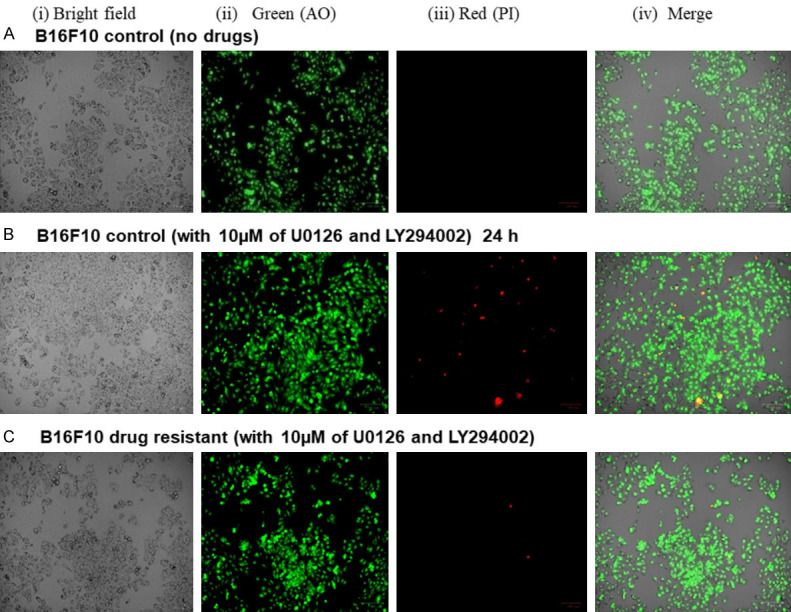
Figure 3.

Live/Dead assay of B16F10C and B16F10R cells. The live/dead assay was performed by acridine orange (AO) and propidium iodide (PI) staining. A shows the result of untreated control B16F10C cells; B shows the results control B16F10C cells treated with the drug combination of U0126 (10 µM) and LY294002 (10 µM); C shows the results B16F10R cells treated with the drug combination. Images were taken phase-contrast microscopy using ZOE Fluorescent Cell Imager (Bio-Rad). Bright field images are from the normal light with no filter. Live cells appeared green in color (AO stain) and dead cells appear red in color.
