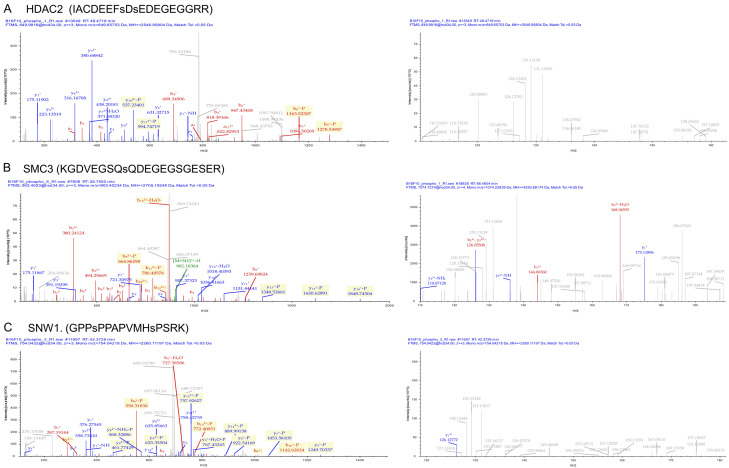
Figure 7.
Phosphoproteins involved in drug resistance in B16F10R cells. Representative MS spectra of hyperphosphorylated proteins. (A) Phosphorylation of peptides on HDAC 2; (B) SMC3 and (C) SNW1 were differentially hyper phosphorylated as evidenced by MS spectra showing the changes in the relative abundance of phosphopeptides.

