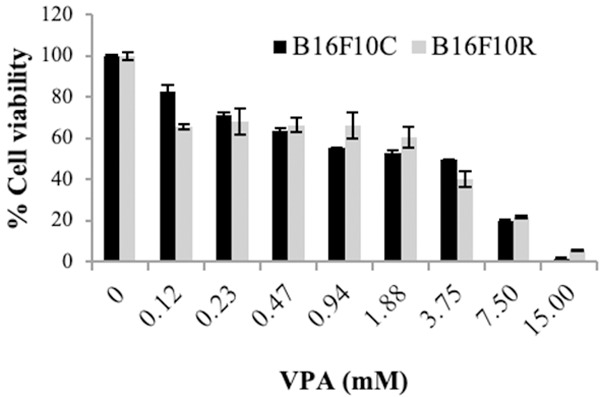
Figure 9.

Cytotoxic effects of VPA on B16F10C and B6F10R cell lines. Both parental and resistant B16F10 cell lines were treated with varying concentrations of VPA (0.1-15 mM) for 72 h and MTT assay was performed. Data shown are means ± SEM of three replicate wells. A graph was plotted with concentration of the VPA (X-axis) vs cell viability % (Y-axis) and the IC50 values were calculated using the formula y = b + ax. An IC50 value is the concentration of the drug which results in 50% cell death. Control (dark bars) and resistant (light bars).
