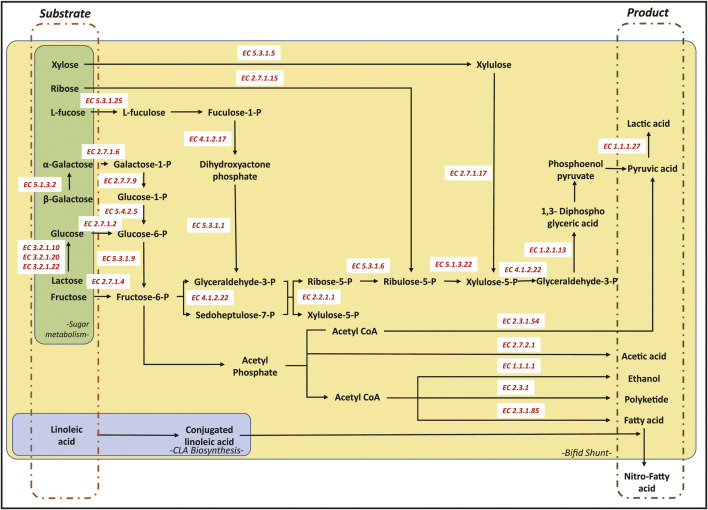
FIGURE 2.
Schematic representation of the Bifid shunt pathway (yellow), CLA pathway (blue) and other carbohydrate degradation pathways (green). All corresponding enzymes in the pathway were annotated using the Enzyme Commission numbers as recommended by the Nomenclature Committee of the International Union of Biochemistry and Molecular Biology (IUBMB).

