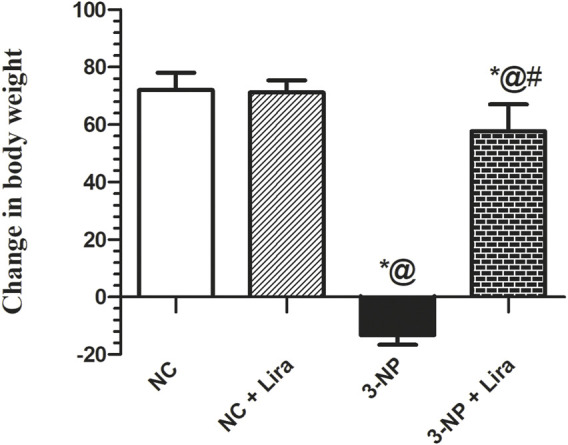
FIGURE 2.

Effect of Lira treatment on body weight in the 3-NP-treated rats. Data are presented as mean ± S.D. (n = 15/group). Statistical analysis was performed using one-way ANOVA followed by Tukey’s multiple comparison test; compared with (*) NC, (#) 3-NP, and (@) NC + Lira groups, p < 0.05. ANOVA, analysis of variance; Lira, liraglutide; NC, normal control; 3-NP, 3-nitropropionic acid.
