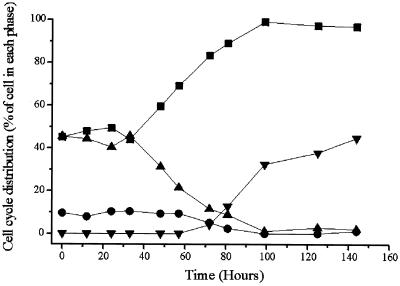
FIG. 3.
Cell cycle analysis of U937T-A/E pool 48 cells upon tetracycline withdrawal. The cell cycle distribution was determined by propidium iodide staining of the cell nuclei at different time points as indicated. The cells were analyzed by flow cytometry. Results for cells in G0/G1 phase (square), G2/M phase (circle), S phase (triangle), and sub-G1 phase (inverted triangle) are shown.

