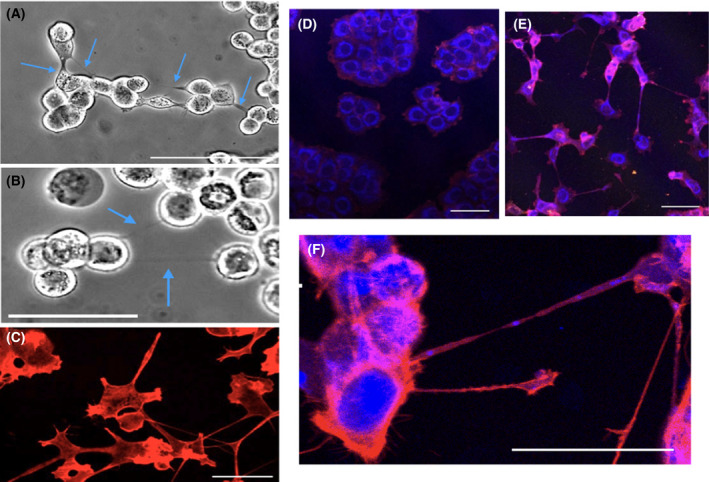
Fig. 2.

Characterization of TNTs formed in MCF‐7 cells following 5‐FU treatment. Key characteristics of TNTs, resistance to trypsin digestion and staining for F‐actin, are shown. (A) MCF‐7 cells (250 μm 5‐FU at 48 h) treated with trypsin (30 min) without disruption of TNTs. Scale bar = 200 μm. (B) MCF‐7 cells (150 μm 5‐FU at 48 h) treatment (60 min) with trypsin does not disrupt TNTs. Scale bar = 100 μm. (C) MCF‐7 cells (250 μm 5‐FU at 48 h) stained with the F‐actin dye, rhodamine phalloidin. Scale bar = 25 μm. Transport of mitochondria through TNTs formed following 5‐FU treatment to MCF‐7. MCF‐7 cells were treated with 5‐FU or vehicle control for 48 h and fixed. TNTs were stained with rhodamine phalloidin (F‐actin dye), while mitochondria were stained using MitoTracker Green. (D) Control MCF‐7 cells. Scale bar = 50 μm. (E) MCF‐7 cells treated with 250 μm 5‐FU at 48 h. (F) Close up of MCF‐7 cells treated with 250 μm 5‐FU at 48 h. Scale bar = 50 μm.
