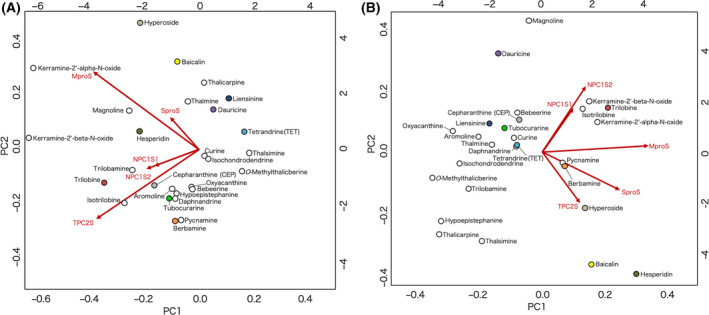
Fig. 2.

Compound distribution in PC1–PC2 plane of docking score. The distributions of the best‐scored compounds on PC1–PC2 planes are shown for (A) ADV and (B) AD4. The compounds are indicted with circles, where those used for assay are differently colored. The scales on the bottom and left of the plot are the PC scores of the compounds for the PC1 and PC2 axes, respectively. The loadings of sign‐inverted docking scores for the target sites to the principal axes are indicated as overlaid red arrows, and the scales on the top and right indicate the corresponding factor loadings. The figure was prepared by using biplot function of R of default settings and scaling.
