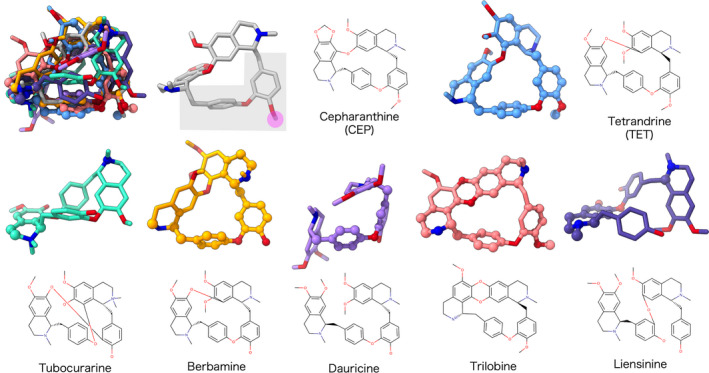
Fig. 4.

Comparison of effective and noneffective CEP analogues. 3D structures of the CEP analogues in the best‐docking‐scored conformations were superimposed to that of CEP in the upper left, which is followed by the separate depictions of the same structures. The colors for the models are coordinated with Fig. 2. The atoms within 1.7 Å from the graph‐matched atoms of CEP are shown in ball models. The suggested pharmacophore and its methyl moiety are meshed in gray and magenta, respectively.
