
Fig. 3.
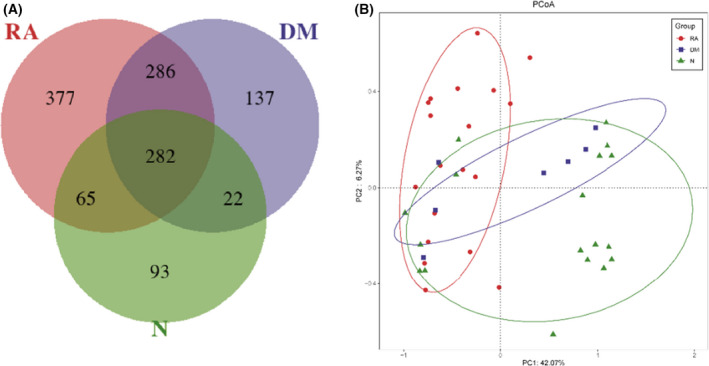
Comparison of the differences in lung microbiota. (A) A Venn diagram displaying overlaps among groups showed that 282 of the 1262 OTUs were common to all the groups, whereas 377 were unique to RA and 137 were unique to DM. (B) Lung microbiota structure in RA (n = 19), DM (n = 7) and N (n = 18) using PCoA based on the Bray–Curtis distance. PCoA of the Bray–Curtis distance PC1–2 showed that the samples of the RA (red), DM (blue) and N (green) groups were distinctly separated in the direction of the PC2 axis, which means that the overall fecal microbiota compositions were markedly different among RA, DM and N. Each symbol represents a sample (red, RA; blue, DM; green, N). Variance explained by the PCs is indicated in the parentheses on the axes.