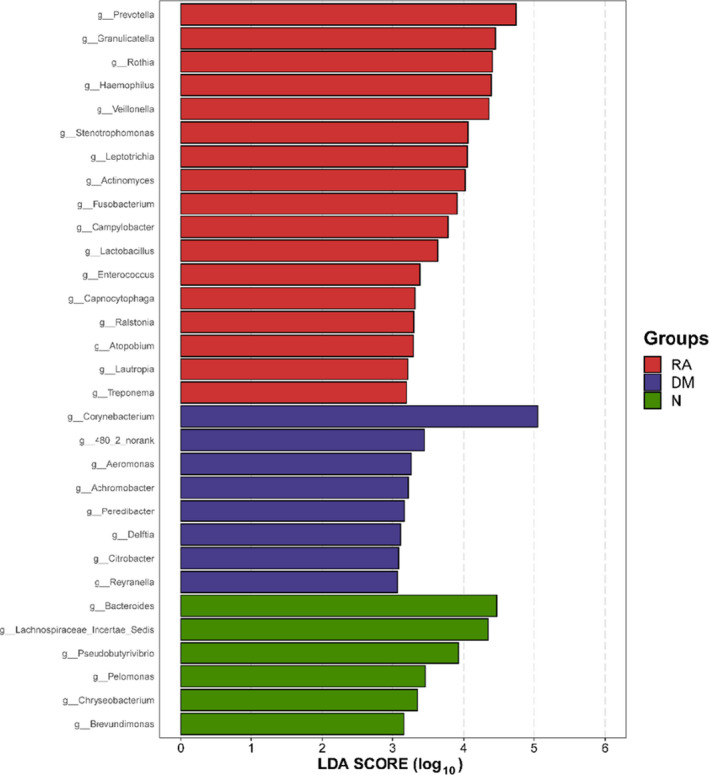
Fig. 6.

LEfSe and LDA analyses based on OTU characterizations of lung microbiota in RA (n = 19), DM (n = 7) and N (n = 18). Histogram of LDA scores calculated for selected taxa showing a significant difference in microbe type and abundance among RA (red), DM (blue) and N (green). LDA score on the log10 scale is indicated at the bottom. The significance of the microbial marker increases with the LDA score.
