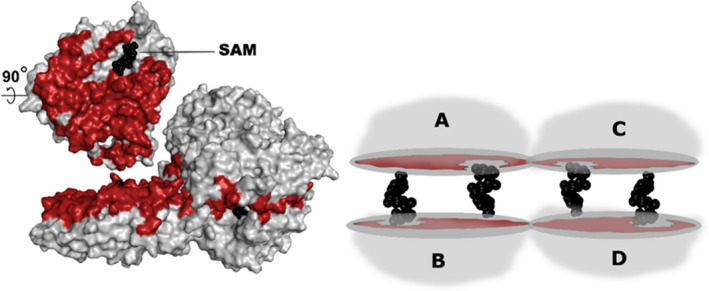
Fig. 1.

MAT homotetramer configuration. Schematic representation of the MAT homotetramer (right) and surface/cartoon view (left)—the large interface region (between chains A and B) is highlighted in red, while SAM is highlighted in black. The large interface formed by chains A and B (also chains C and D), which have an area of ˜ 1900–2000 Å2, consists of ˜ 70–100 residues. Representative structures have been utilized here, while the archaeal pfMAT structure (PDB ID: 6S83 from Pyrococcus furiosus) utilizes 83 residues to give rise to the large interface. These numbers are 90 residues in case of bacterial eMAT (Escherichia coli, PDB ID: 1RG9) and 77 in the case of eukarya hMAT2A (Homo sapiens, PDB ID: 4NDN).
