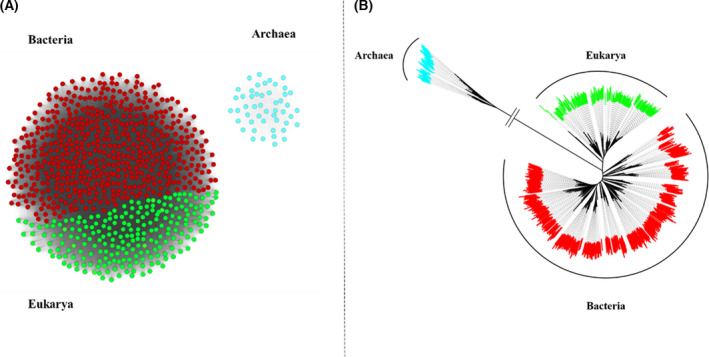
Fig. 2.

Schematic representation of observed sequence space in MAT. (A) SSN of MATs from the three domains—the sequences from eukarya (green) and bacteria (red) form a distinct cluster, while the sequences from archaea (cyan) form a separate cluster. This SSN was created with the EFI enzyme similarity server and visualized using the Cytoscape program. Clustering pattern within the network at different levels of sequence similarity (similarity %) can be observed in the supplementary information (Fig. S1). (B) Unrooted ML tree for MATs from the three domains of life. This unrooted tree was built by applying the ML method with IQ‐TREE, followed by visualization using FigTree viewer program and iTOL server. The archaeal MATs branch off, thereby highlighting their divergence, an observation that was further substantiated through SSN. The archaeal MATs are represented in cyan, eukarya in green, and bacteria in red.
