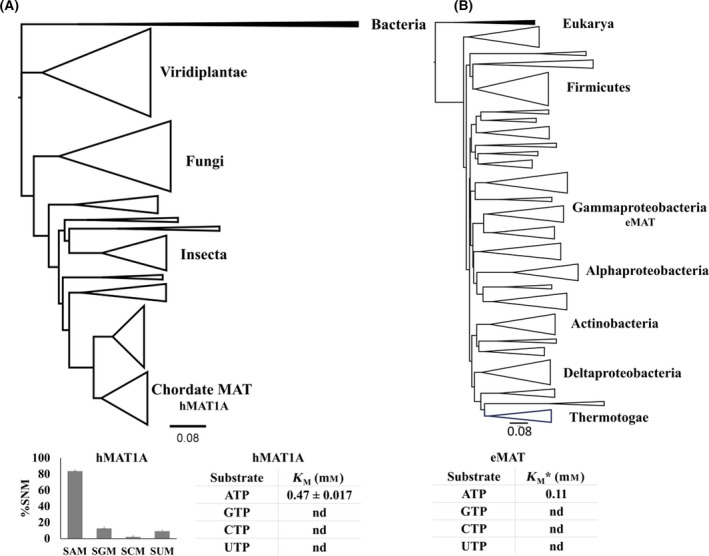
Fig. 4.

Phylogenetic trees based on the MAT sequences for eukarya and bacteria domains. (A) ML phylogenetic tree of MAT sequences from domain eukarya, with bacterial MAT sequences as an outgroup (highlighted in black). The major clades have been annotated according to their distribution in the tree topology. We reported the activity of hMAT1A as representative of domain eukarya. One time point assay for hMAT1A activities was performed using 20 µm of hMAT1A with NTPs (5 mm) and methionine (10 mm) in HEPES (100 mm), KCl (50 mm), and MgCl2 (10 mm), pH 8, at 37 °C, 1 h. For kinetics analysis, hMAT1A (0.5 µm), ATP (0.1–2 mm), and methionine (10 mm) using the same above‐mentioned buffer and conditions were used. The experiments were performed in duplicates. The error bars represent SD. Tables showing the extrapolated K M for hMAT1A. (B) ML phylogenetic tree of MAT sequences from bacteria domain, with eukarya MAT sequences utilized as an outgroup (highlighted in black). *We also highlight the K M of ATP from eMAT as a representative of bacteria domain, as reported previously [48]. These results suggest that both the enzymes, hMAT1A and eMAT, are not promiscuous, as they display specificity toward ATP. The trees were built using the ML method with the IQ‐TREE program. Tree topologies were visualized using FigTree program.
