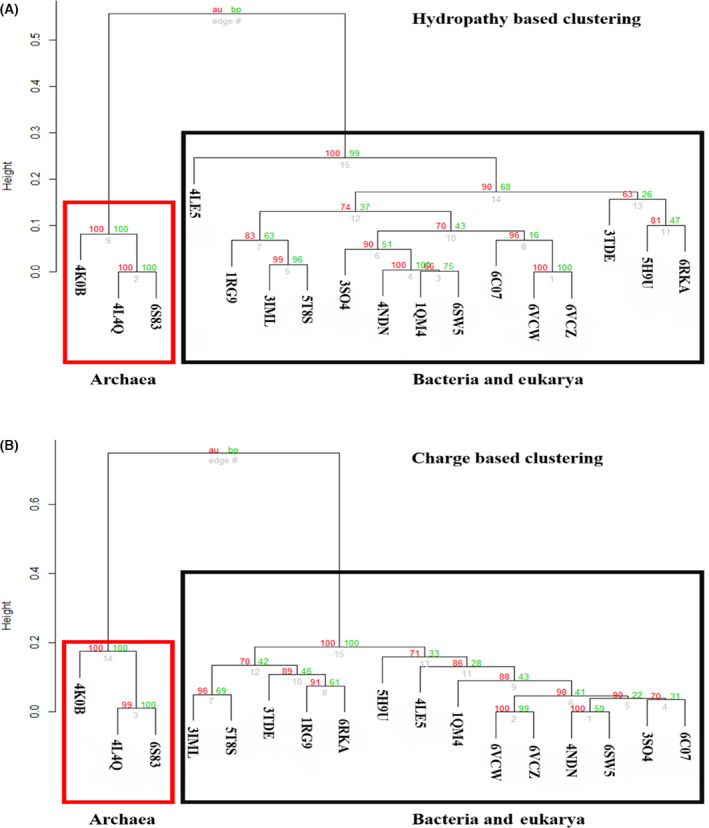
Fig. 6.

Clustering analysis of hydropathy (A) and charge (B) of representative structures from the three domains of life. Clustering analysis of the physiochemical properties (hydropathy and charge) of 51 structurally aligned large interface residues from chain A of 17 MAT structures (PDB list in the supplementary information). Based on the 51 aligned positions, we calculated the per‐site hydropathy using the Kyte–Doolittle scale from the ProtScale server. In addition, we calculated the per‐site charges for the 17 MAT structures using the EMBOSS charge server. Subsequently, we conducted a clustering analysis using the pvclust package in r. This further provides a statistical score in terms of AU (AU scores depicted in red), P‐value, and BP (bootstrap probability scores depicted in green) value, for comparison of the clusters, which reveals that the hydropathy (A) and charge distribution (B) clustered together for bacterial and eukarya MAT structures, with archaeal MAT structures clustered separately. In both cases, the archaeal cluster was provided with high support values, in terms of both the AU and BP parameters, and 100% support for a distinct archaeal cluster with respect to the two physiochemical properties.
