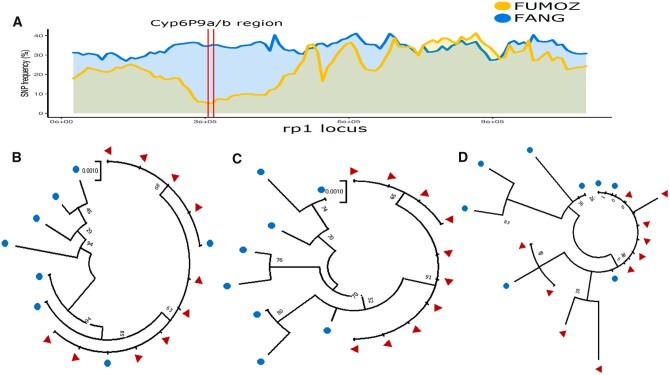
Figure 4.
Polymorphism patterns on the genomic regions spanning the rp1 QTL regions including CYP6P9a and b. (A) Comparative SNP frequency along the 2R chromosome region spanning rp1 showing a marked reduced diversity in FUMOZ notably at the vicinity of the highly over-expressed CYP6P9a and CYP6P9b genes. (B) Maximum likelihood phylogenetic tree of CYP6P9a sequences generated from RNAseq data between FUMOZ and FANG. (C) Is for CYP6P9b and (D) is for CYP4C36.

