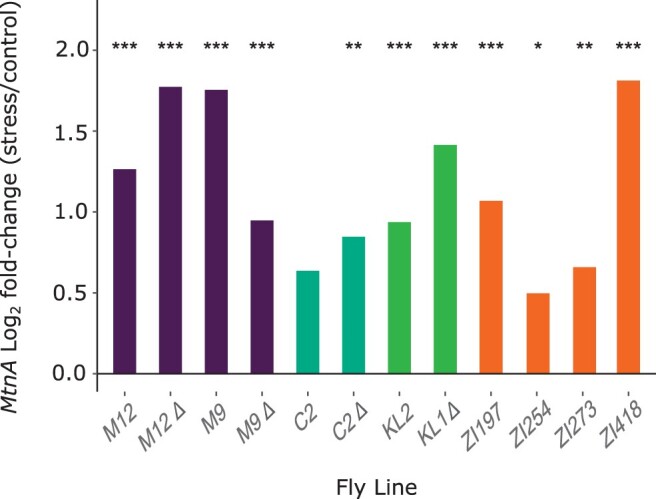
Figure 5.

Log2 fold-change in MtnA expression induced by oxidative stress in different backgrounds: Munich, Germany (M9 and M12); Nicosia, Cyprus (C2); Kuala Lumpur, Malaysia (KL), and Siavonga, Zambia (ZI). Lines homozygous for the MtnA 3′ UTR deletion are denoted by “Δ.” Asterisks indicate the adjusted P-value from a Wald test as applied in DESeq2. * P < 0.05, **P < 0.01, ***P < 0.001.
