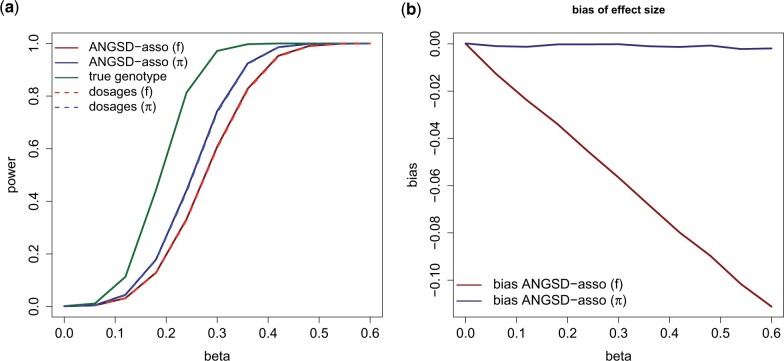
Figure 3.
Simulation scenario 4 with varying genotype effect size (β). We have a structured population with the same admixture proportions and mean sequencing depth as in Figure 2C. There is an effect of ancestry of population 1 (γ = 1). We use a significance threshold of . The linear model is adjusted for ancestry. Each point is based on 10,000 simulations. (A) Statistical power to detect an association, using ANGSD-asso’s latent model and dosage model respectively with a sample frequency prior (f) and an individual allele frequency prior (π). (B) Bias of the estimated effect sizes.

