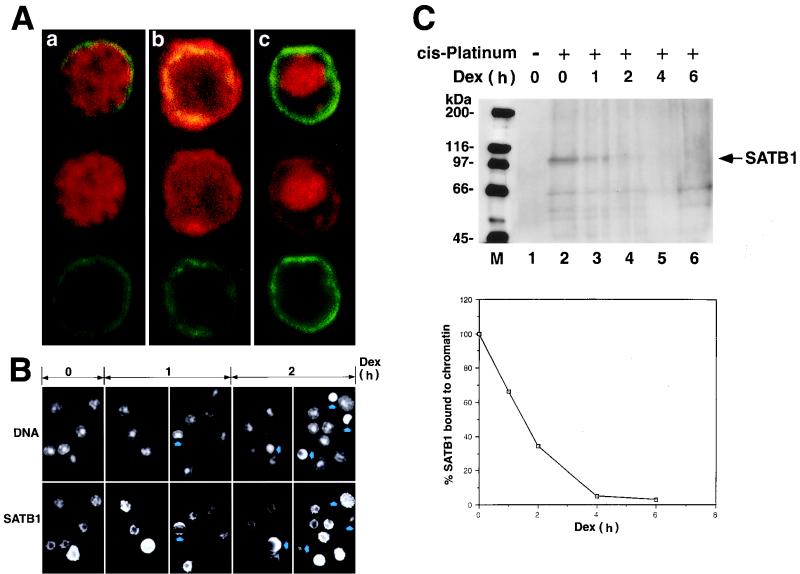
FIG. 1.
SATB1 dissociates from chromatin early during apoptosis. (A) Confocal analysis of immunofluorescence staining of lamin B and SATB1. Rat thymocytes treated with 2 μM dexamethasone for 2 h were double immunostained with anti-SATB1 antibody (red) and anti-lamin B antibody (green). Individual cells in very early (a), middle (b), and late stages of apoptosis (c) are shown. (B) Double staining of genomic DNA and SATB1 with Hoechst 33258 dye (top) and anti-SATB1 antibody (bottom) from thymocytes treated with dexamethasone (dex) for 0, 1, and 2 h. Arrows indicate apoptotic cells with apparent morphological alteration. Differences in SATB1 staining pattern and the sizes of cells reflect the different developmental stages of the thymocyte (our unpublished result). (C) (Top) Dissociation of SATB1 from chromatin early in apoptosis. Dexamethasone-treated thymocytes at different time points were incubated with 50 mM cis-DDP and solubilized in 4% SDS, and DNA-protein complexes (cross-linked genomic DNA fraction) were pelleted by ultracentrifugation. The pellets were resuspended in 5 M urea–2% SDS, and untracentrifugation was repeated to isolate DNA-cross-linked proteins. The pellets were sonicated and treated with DNase I. The solubilized protein fractions were subjected to SDS–7.5% PAGE and Western blot analysis using anti-SATB1 polyclonal serum. Positions of the molecular mass markers (in kilodaltons) are indicated on the left. Arrow, band corresponding to full-length SATB1. Other faint bands, representing nonspecific cross-reactivity of the anti-SATB1 antibody, became visible only after longer exposure of a Western blot. (Bottom) Densitometric analysis of the SATB1 signals shown at the top. Intensity of the band corresponding to full-length SATB1 was quantitated using a laser densitometer and plotted as a function of time after dexamethasone treatment. All values were normalized to the intensity of the SATB1 signal in the absence of dexamethasone treatment (lane 2) and were expressed as percentages of the zero time value.

