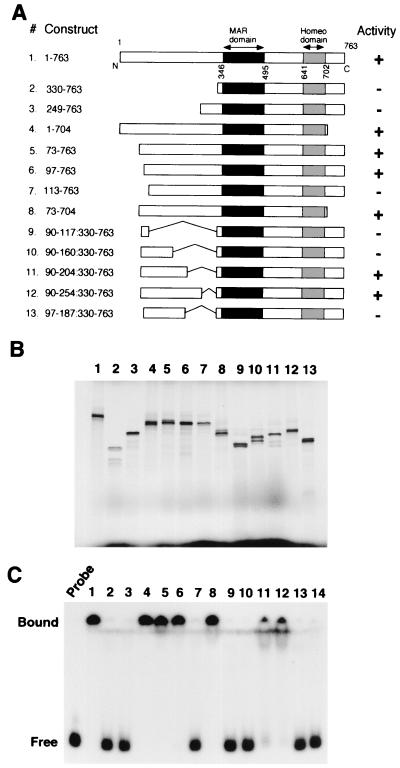
FIG. 7.
Identification of an N-terminal domain that is required for the DNA-binding activity of SATB1. (A) Schematic representation of SATB1 N- and C-terminal and internal deletions. Various truncated versions of SATB1 cDNA that were used as templates for coupled in vitro transcription and translation are shown. Construct 1 depicts all the known functional domains in SATB1. All the constructs are named according to the amino acids encoded by the full-length cDNA that they represent. Black boxes, MAR-binding domain; gray boxes, homeodomain. The result of DNA-binding studies using these constructs is summarized in the “Activity” column. +, DNA-binding activity comparable to that of the full-length protein; −, total lack of DNA binding. (B) SDS-PAGE analysis of in vitro translation products. Coupled in vitro transcription and translation of SATB1 with various terminal and internal deletions as depicted in panel A were performed as described in Materials and Methods. The 35S-labeled translation products were resolved by SDS-10% PAGE and visualized by autoradiography. The numbers above each lane correspond to the constructs depicted in panel A. The dark patch at the bottom of the gel indicates position of the dye front. (C) EMSA analysis. The DNA-binding activity of each of the above constructs was monitored by EMSA analysis using a 32P-labeled WT (25)7 probe as described in Materials and Methods. Numbers on top of lanes correspond to those of the constructs in panel A. Lane 14, control binding reaction using vector (pBlueScript)-translated lysate. Free and bound, positions of the unbound and protein-bound DNA probes, respectively.

