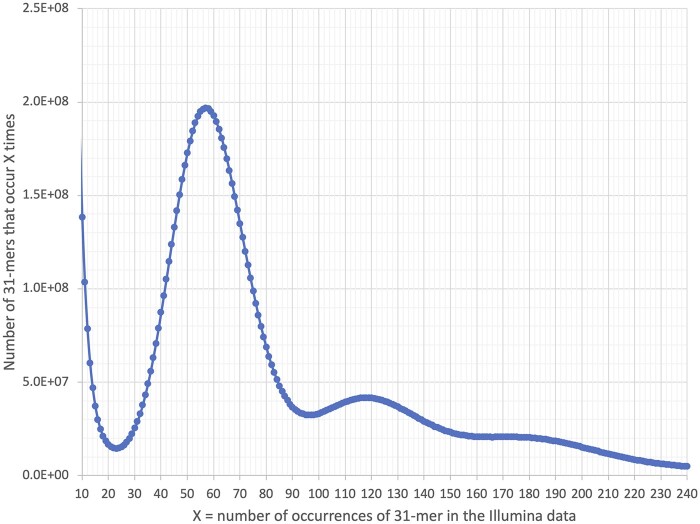
Figure 1.
The distribution of 31-mers in coast redwood Illumina short-read data collected from a haploid sample. The primary peak is at X = 57. The number of 31-mers is estimated using the area under the curve, excluding the low-count k-mers that likely are due to errors in base-calling. The three peaks (X = 57: ∼118 and ∼180) reflect the hexaploid nature of the genome; these contain 31-mers that are identical in two or three of the subgenomes.

