Figure 1.
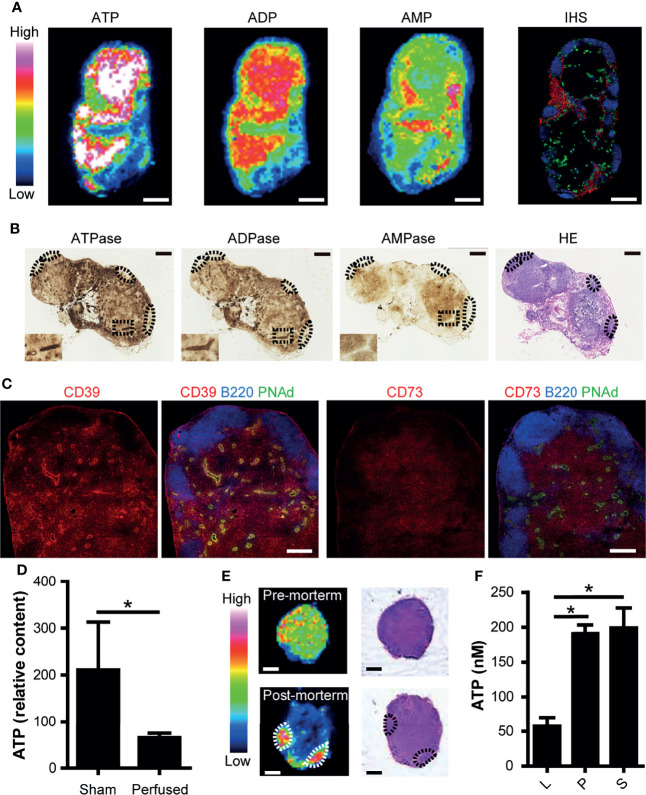
ATP and ATP-degrading enzymes are constitutively expressed in the paracortex of uninflamed LNs. (A) Imaging mass spectrometry analysis of adenine nucleotides in uninflamed LN. Serial sections of inguinal LNs were used for MALDI-IMS imaging and immunohistochemical (IHC) analyses. Representative MALDI-IMS images for ATP, ADP, and AMP in LN from three individual experiments are shown. Rainbow color scales were used. The white color represents the highest signal intensity (100%) and the black color represents the lowest signal (0%) of a specific ion. A serially-cut cryosection of LN was stained for B220 (blue), PNAd (green), and Lyve-1 (red). Scale bar, 500 μm. (B) Enzyme histochemical staining for ATPase, ADPase, and AMPase. The inset shows a representative area in the paracortex with an HEV in the middle. B cell follicles are indicated by dotted circles. Scale bar, 500 μm. (C) Confocal microscopic images of an inguinal LN stained for CD39 and CD73. On the left, a cryosection was stained for CD39 (red), B220 (blue), and PNAd (green). On the right, a serially-cut section was stained for CD73 (red), B220 (blue), and PNAd (green). Scale bar, 200 μm. (D) ATP content in inguinal LNs before and after transcardial perfusion with PBS, as determined by capillary electrophoresis-electrospray ionization-mass spectrometry. Data represent the mean ± SEM from at least three independent experiments. *p<0.05 by Student’s t-test. (E) IMS analysis of ATP (left column) and H&E staining (right column) of inguinal LNs pre-mortem and post-mortem. (F) ATP content in thoracic duct lymph (L), plasma (P), and serum (S). Data represent the mean ± SEM from three independent experiments. *p<0.05 by one-way analysis of variance followed by Tukey’s multiple comparison test, compared with L.

