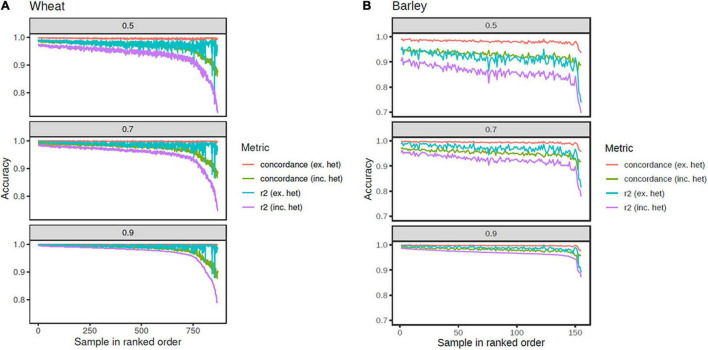
FIGURE 4.
Imputation accuracy from the tSNPs on the array to the set of SNPs tagged at r2 ≥ 0.5, 0.7, and 0.9, in wheat (A) and barley (B). Metrics plotted are correlation r2 including heterozygous calls (purple line), r2 excluding heterozygous calls (cyan line), concordance including heterozygous calls (green line), and concordance excluding heterozygous calls (orange line). The accessions are rank ordered based on the r2 including heterozygous calls.

