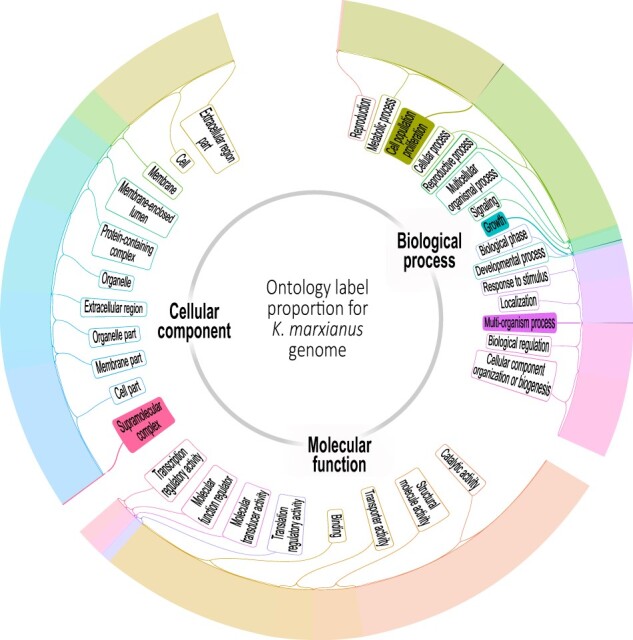
Figure 3.

Ontology enrichment. The bar graphs surrounding the plot circumference are represented by the relative frequency of genes in each ontology term. Nonfilled boxes are ontologies present in both haplotypes while color-filled boxes represent functions present in only one haplotype.
