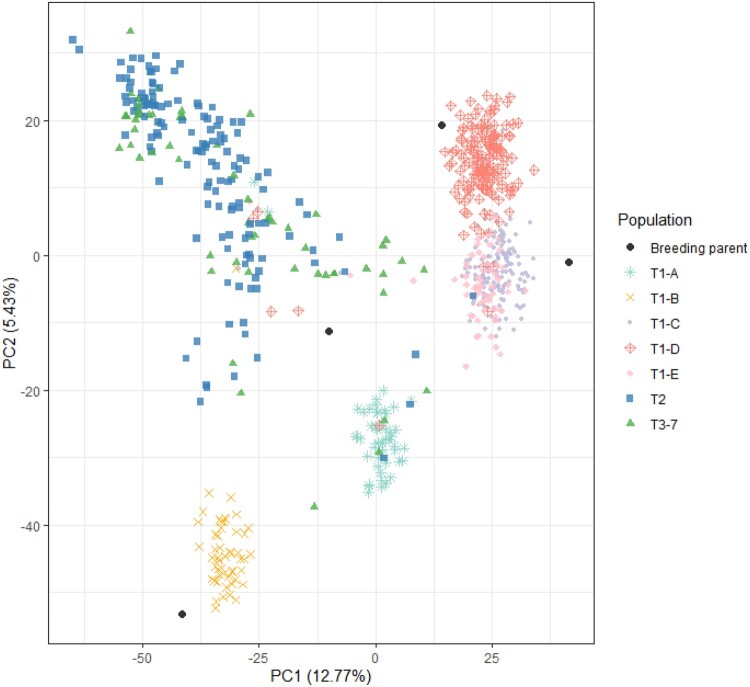
Figure 1.
Principal coordinate analysis (PCoA) based on the Euclidian genetic distance between genotyped individuals. Colored groupings are made based on breeding populations across various selection cycles, T1–T3–7. The five full-sib families of population T1 are also separated by color. Four cultivars or breeding clones from the bi-parental crosses that produced the T1 families are included as breeding parents. PC1 and PC2 are the % variance explained by the two first principal components.

