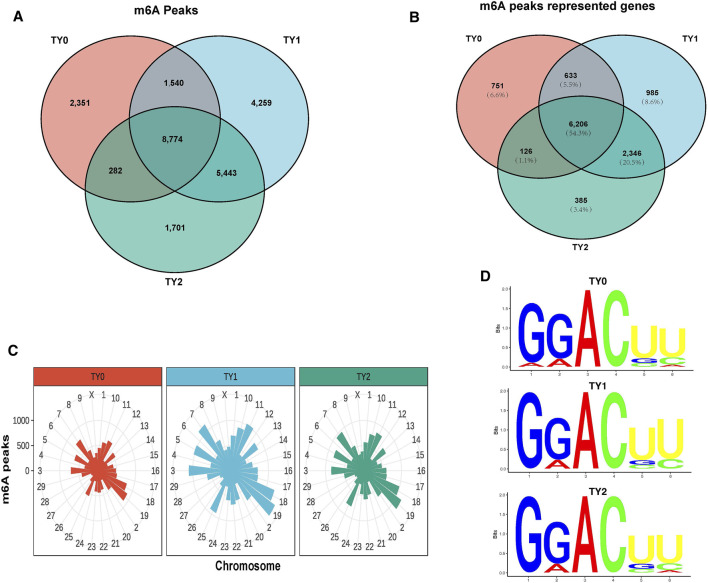
FIGURE 1.
Transcriptome-wide m6A analysis in bovine testes. (A) The number of common and specific m6A peaks in three groups. (B) The Venn diagram shows the m6A-related transcripts in three groups. (C) Distribution of m6A peaks across chromosomes in the three groups. (D) The top motifs enriched from m6A peaks were identified among the studied groups.

