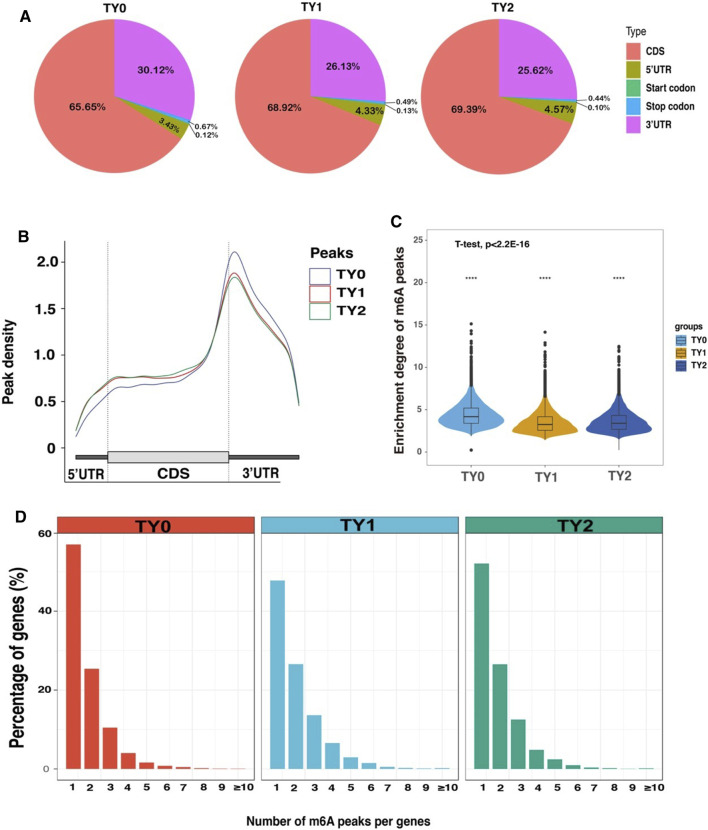
FIGURE 2.
Overview of m6A methylation profiles in bovine testes. (A) Pie charts demonstrating m6A peak distribution in the gene structures of mRNAs. (B) Metagene plots displaying the regions of m6A peaks identified across the transcripts in TY0, TY1, and TY2 groups. (C) Violin plot displays the distribution of enrichment degree of m6A peaks in each group. (D) The number of m6A peaks per gene in the TY0, TY1, and TY2 groups.

