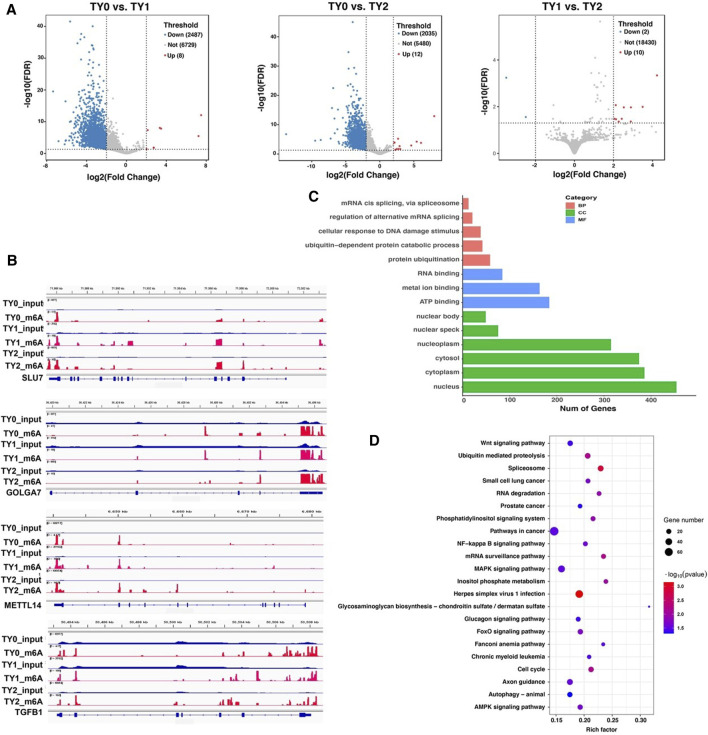
FIGURE 3.
Distribution of significantly differential m6A peaks between the pairwise comparison groups. (A) Volcano plots showing the differential peaks between the studied groups. (B) Data visualization analysis of differential m6A peaks in the selected mRNAs (SLU7, GOLGA7, METTL14, and TGFB1) among the studied groups. (C) GO analysis for differentially methylated genes. (D) KEGG enrichment analysis for differentially methylated genes.

