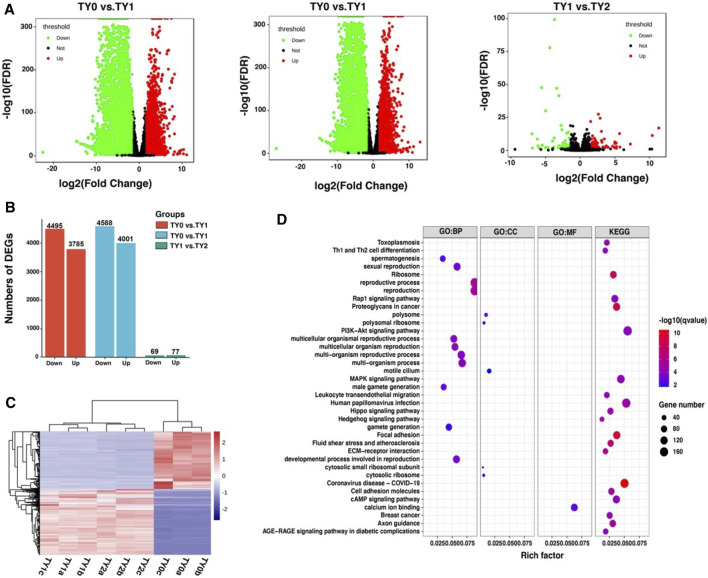
FIGURE 4.
Differential expression analysis of RNA-Seq data among the studied groups. (A) Volcano plots showing the differential expressed genes between the studied groups. (B) Barplot showing the number of up-and down-regulated DEGs. (C) Heatmap plot of all DEGs among the studied groups. (D) GO and KEGG enrichment analysis of all DEGs.

