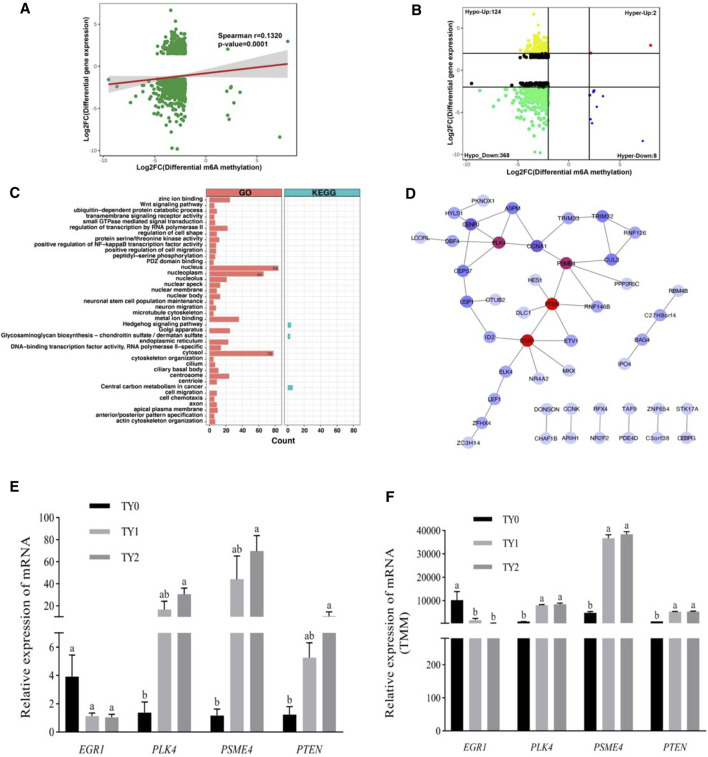
FIGURE 5.
Conjoint analysis of m6A-Seq and RNA-Seq data. (A) Dot plot of Log2 FC (mRNA expression) versus Log2 FC (differential m6A methylation) revealing a positive association between total m6A methylation and level of mRNA expression. (B) Four quadrant plots showing differentially expressed genes with differentially methylated m6A peaks. (C) GO and KEGG pathway enrichment analysis of the genes with a significant change in both m6A and mRNA levels. (D) Protein-protein interactions (PPIs) of the genes enriched in the nucleus of GO terms. The red circle represents the node with a high degree, while the blue circle indicates the node with a low degree. (E) The relative mRNA levels were determined by the qPCR of four hub genes in three groups. (F) The genes change levels based on RNA-Seq data.

