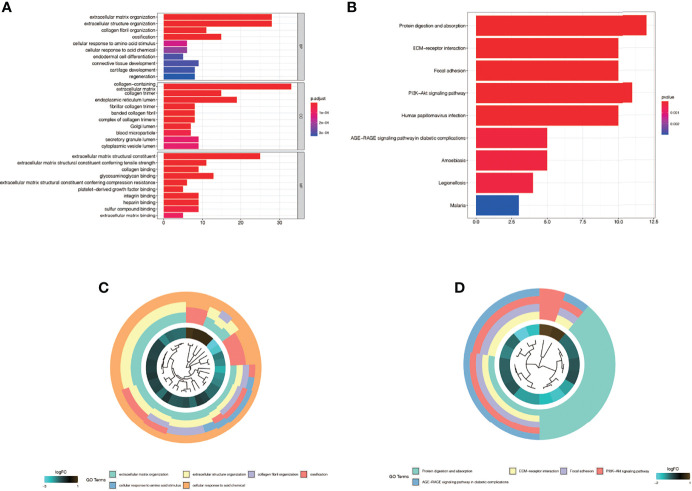
Figure 4.
Enrichment analysis in the single-cell dataset GSE163973. (A) The Gene ontology (GO) enrichment. The results were divided into biological process (BP), cell component (CC) and biological function (MF). (B) Kyoto Encyclopedia of Genes and Genomes enrichment (KEGG). (C) The first five most significant GO enrichment results are shown in a circle graph. (D) The first five most significant KEGG enrichment results are shown in a circle graph.

